
Statistics & Data Visualizations
Commercial Mortgage-Backed Securities (CMBS) Issuances
March 16, 2026
Commercial mortgage-backed securities (CMBS) are debt securities secured by cash flows from commercial real-estate mortgages. CMBS issuance statistics provide aggregate information about the volume of registered CMBS offerings, Rule 144A, Agency, and Outside U.S.
Data Visualizations
Click on the link below each image to access interactive features of the graph.
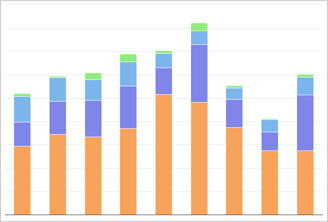
Number and Volume by Offering Type
(2016 - 2025 and 2016:Q1 - 2025:Q4)
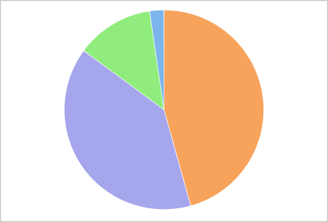
Number and Volume by Offering Type
(2024 and 2025)
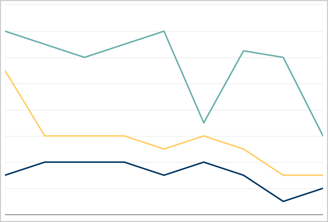
CMBS Deal Structure
(2016 - 2025)
Statistics
Below are the most recent quarterly statistics for 2025 and annual statistics for 2024 and 2025. CMBS issuance statistics are updated quarterly. For all available CMBS issuance statistics from 2016:Q1 to 2025:Q4, view Statistics Download.
| Metric | 2024 | 2025 | 2025 Q1 | 2025 Q2 | 2025 Q3 | 2025 Q4 |
|---|---|---|---|---|---|---|
| Number of CMBS issuances | 302 | 348 | 79 | 77 | 90 | 102 |
| Number of CMBS issuances by offering type | - | - | - | - | - | - |
| 144A | 119 | 137 | 28 | 28 | 37 | 44 |
| Agency | 138 | 150 | 36 | 36 | 39 | 39 |
| Outside US | 7 | 17 | 5 | 4 | 4 | 4 |
| Registered | 38 | 44 | 10 | 9 | 10 | 15 |
| Total CMBS deal volume (US$ Billions) | 156.5 | 196.0 | 50.3 | 37.3 | 45.7 | 62.7 |
| CMBS deal volume by offering type (US$ Billions) | - | - | - | - | - | - |
| 144A | 75.1 | 95.1 | 26.4 | 16.0 | 21.9 | 30.8 |
| Agency | 45.8 | 57.9 | 13.2 | 12.8 | 14.0 | 17.8 |
| Outside US | 2.8 | 9.3 | 2.0 | 2.1 | 3.3 | 1.9 |
| Registered | 32.9 | 33.7 | 8.6 | 6.4 | 6.4 | 12.2 |
Statistics Guide
The Guide below provides a description of each metric, calculation method, and data source. To download CMBS Issuance Statistics Guide: CMBS Issuance Statistics Guide
Description
The number of CMBS issuances is the number of CMBS deals in each time period.
Calculation Method
The estimate is produced by counting the issuances of CMBS in each time period. The estimates include initial terms of securities collateralized by mortgage loans and other types of debt on commercial and multifamily properties and contains all rated CMBS that are 1) secured by a static pool of mortgage loans or leases on income-producing commercial and/or multifamily properties; 2) have a trustee and at least one underwriter; and 3) have at least one tranche rated by a nationally recognized statistical rating organization (NRSRO). The time of offering is based on the pricing date, which is the date on which pricing terms are struck for all or most of the securities that pay principal and interest.
Data Source
CM Alert by Green Street Advisors
Description
The number of CMBS issuances by offering type is the number of CMBS deals by offering type in each time period.
Calculation Method
The estimate is produced by counting the issuances of CMBS by offering type in each time period. The offering types are asset-backed securities that are issued or guaranteed by a U.S. government agency or government-sponsored enterprise (Agency), asset-backed securities that are exempt from registration pursuant to Rule 144A of the Securities Act of 1933 (144A), asset-backed securities registered with the U.S. Securities and Exchange Commission (Registered), and asset-backed securities that are issued outside the United States (Outside U.S.). The estimates include initial terms of securities collateralized by mortgage loans and other types of debt on commercial and multifamily properties and contains all rated CMBS that are 1) secured by a static pool of mortgage loans or leases on income-producing commercial and/or multifamily properties; 2) have a trustee and at least one underwriter; and 3) have at least one tranche rated by a nationally recognized statistical rating organization (NRSRO). The time of offering is based on the pricing date, which is the date on which pricing terms are struck for all or most of the securities that pay principal and interest.
Data Source
CM Alert by Green Street Advisors
Description
Total CMBS deal volume is the total dollar amount of CMBS deals for each time period.
Calculation Method
The estimate is produced by aggregating deal volume from CMBS issuances in each time period. The estimates include initial terms of securities collateralized by mortgage loans and other types of debt on commercial and multifamily properties and contains all rated CMBS that are 1) secured by a static pool of mortgage loans or leases on income-producing commercial and/or multifamily properties; 2) have a trustee and at least one underwriter; and 3) have at least one tranche rated by a nationally recognized statistical rating organization (NRSRO). The time of offering is based on the pricing date, which is the date on which pricing terms are struck for all or most of the securities that pay principal and interest.
Data Source
CM Alert by Green Street Advisors
Description
CMBS deal volume by offering type is the total dollar amount of CMBS deals placed in each time period by offering type.
Calculation Method
The estimate is produced by aggregating deal volume from CMBS issuances by offering type in each time period. The offering types are asset-backed securities that are issued or guaranteed by a U.S. government agency or government-sponsored enterprise (Agency), asset-backed securities that are exempt from registration pursuant to Rule 144A of the Securities Act of 1933 (144A), asset-backed securities registered with the U.S. Securities and Exchange Commission (Registered), and asset-backed securities that are issued outside the United States (Outside U.S.). The estimates include initial terms of securities collateralized by mortgage loans and other types of debt on commercial and multifamily properties and contains all rated CMBS that are 1) secured by a static pool of mortgage loans or leases on income-producing commercial and/or multifamily properties; 2) have a trustee and at least one underwriter; and 3) have at least one tranche rated by a nationally recognized statistical rating organization (NRSRO). The time of offering is based on the pricing date, which is the date on which pricing terms are struck for all or most of the securities that pay principal and interest.
Data Source
CM Alert by Green Street Advisors
Description
Deal structure is described with distributional statistics via quartiles in the number of classes per deal based on reported tranche information.
Calculation Method
CMBS deals are sorted by the number of classes in each deal for each time period. The number of classes for the deal at the 25th %-ile, at the 50th %-ile (median), and at the 75th %-ile of this measure are reported. The estimates exclude resecuritizations identified as observations with deal type “re-REMIC” for resecuritizations of real estate mortgage investment conduits and agency deals identified based on offering type.
Data Source
CM Alert by Green Street Advisors
Statistics Download
The file below contains all available CMBS issuance statistics from 2016:Q1 to 2025:Q4.
| File | Format | Size |
|---|---|---|
| CMBS Issuance Statistics | xlsx | 31.6KB |
Related Materials
- Research and Reports:
- Regulatory Background:
These statistics are produced by the staff of the U.S. Securities and Exchange Commission and the Commission expresses no view regarding the statistics. The statistics are produced from commercial data sets provided by third parties. Staff cannot guarantee the accuracy of third-party data. The statistics may change based on updated or revised data and methodology.
Citation
Author: U.S. Securities and Exchange Commission Staff
Name: SEC Statistics & Data Visualizations: Commercial Mortgage-Backed Securities (CMBS) Issuances
Publication Date: Mar. 17, 2026
Last Reviewed or Updated: March 17, 2026